How to Visualize Data
Open Data Capture allows you to visualize numeric measures over time in a single subject. These measures must be defined in the instrument.
Steps
-
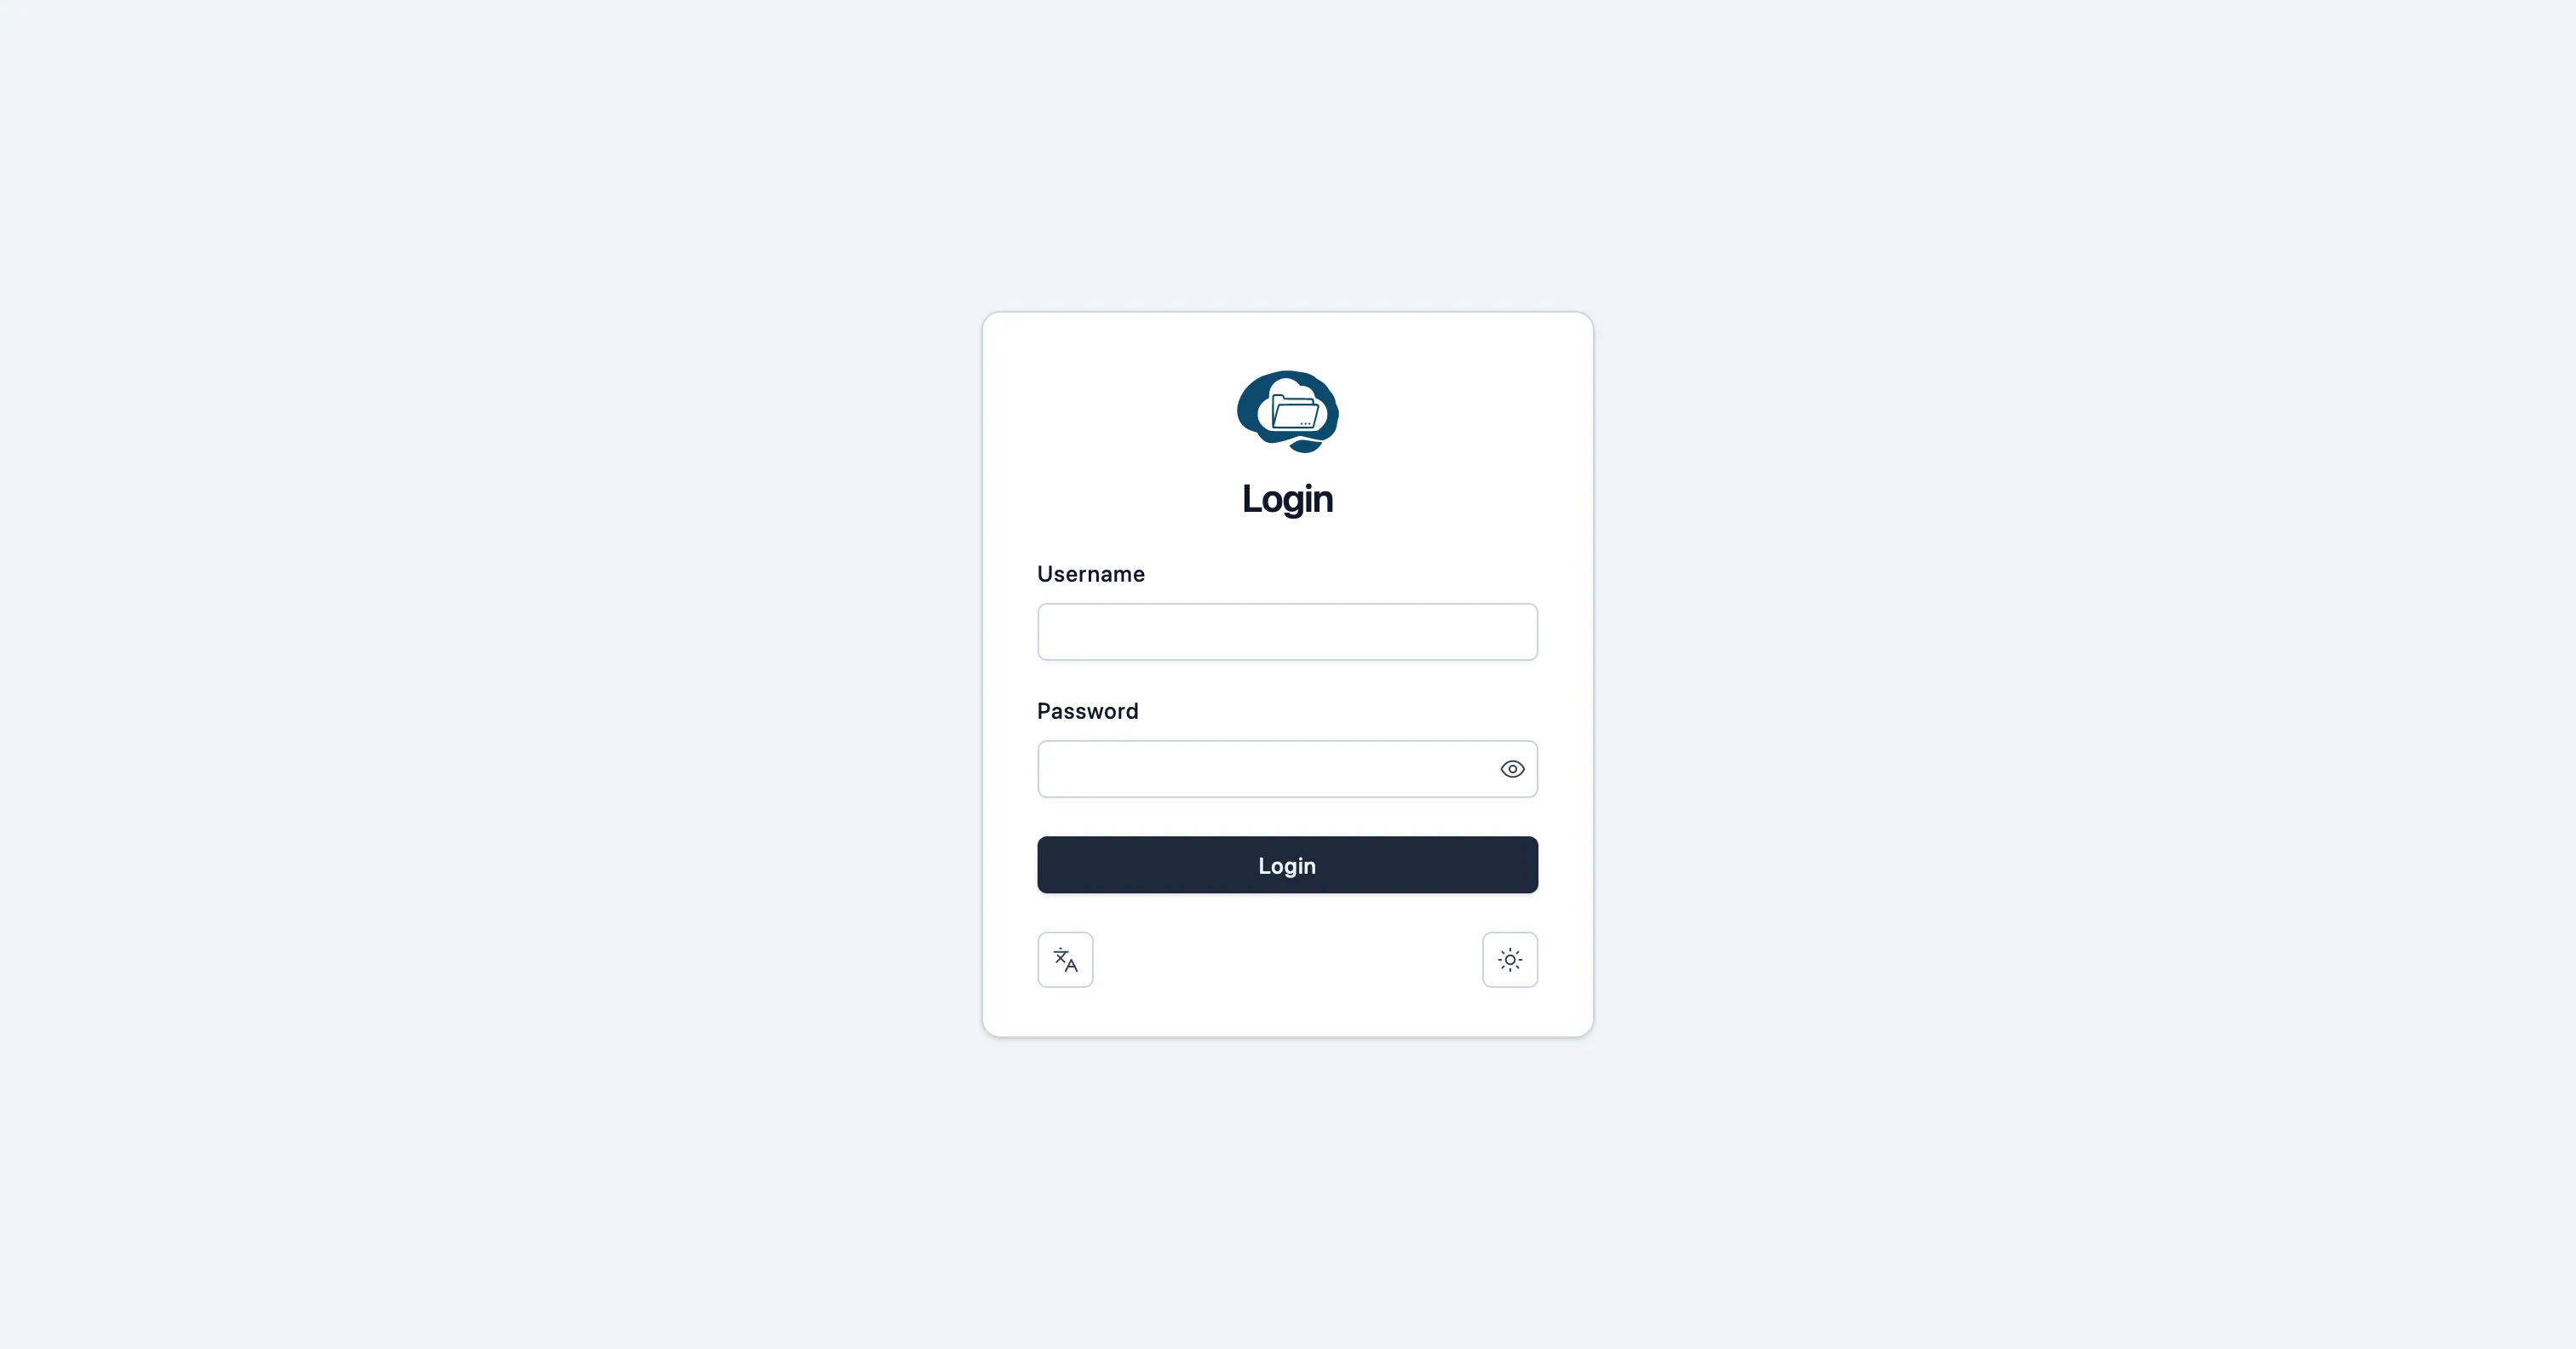
Login to Open Data Capture
First, login to your instance of Open Data Capture. In order to visualize subject data, you must have adequate permissions. Usually, that means you must be a group manager (or equivalent).
-
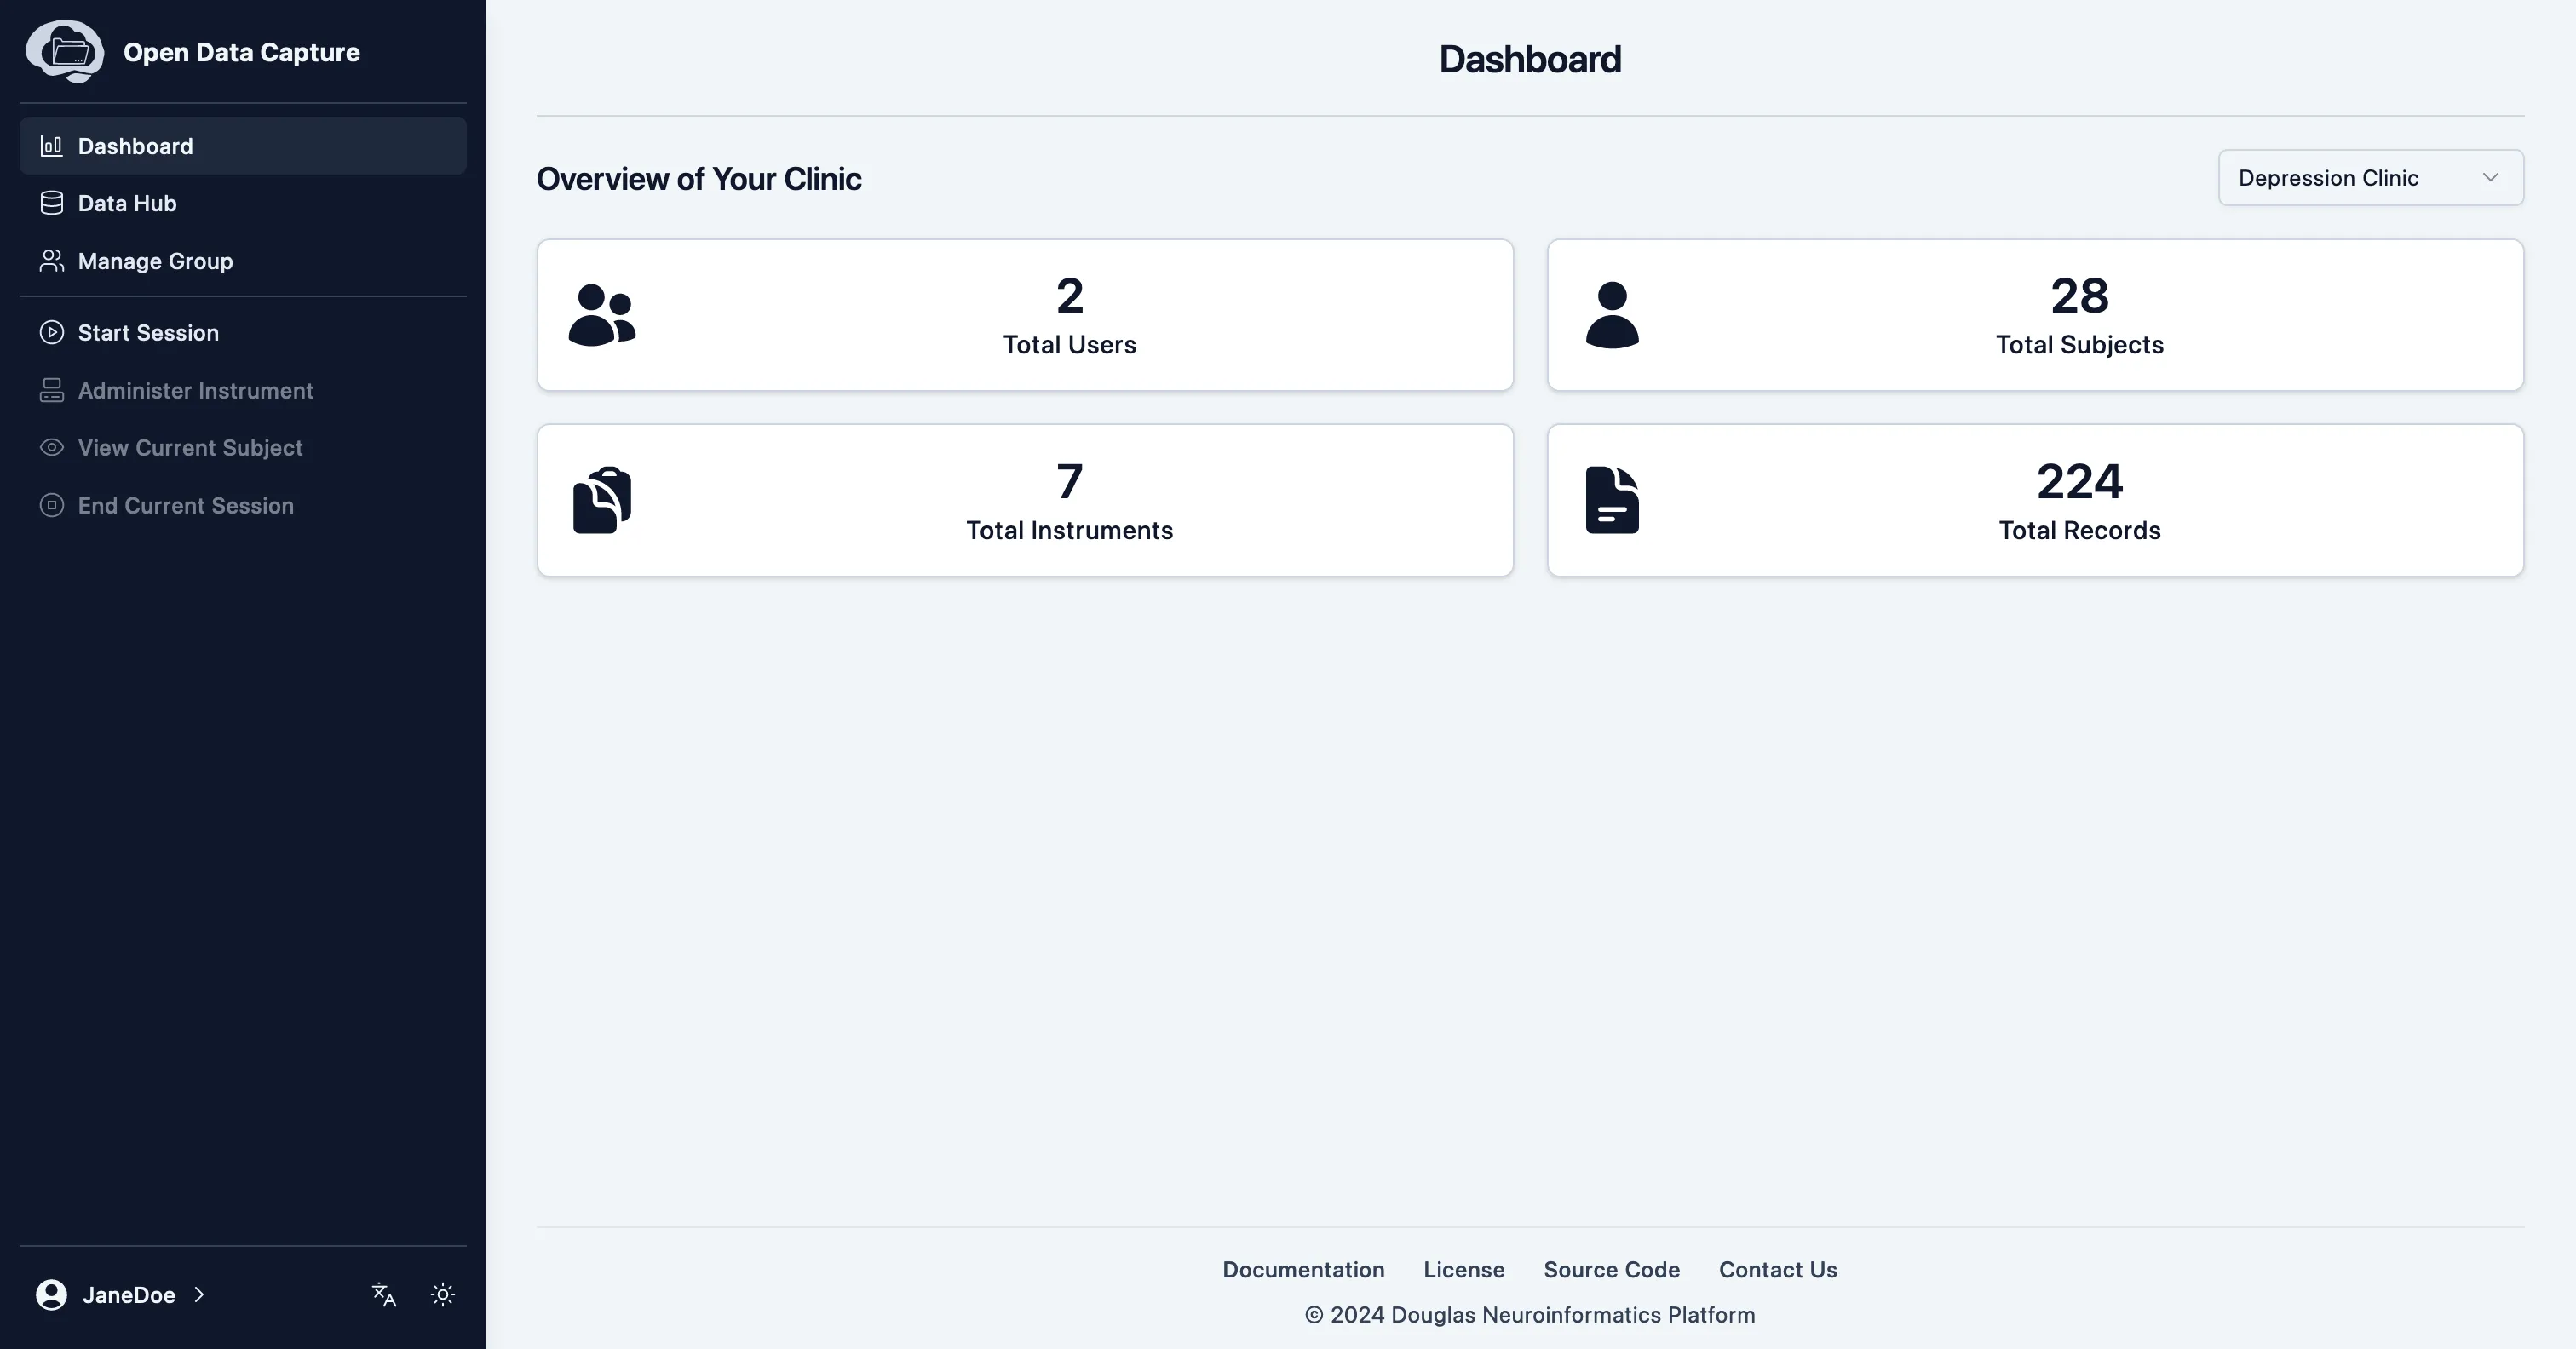
Select Your Group
Next, select the group that you were using when you collected the data for this subject (or were using to send the subject a remote assignment). It is very important that you select the correct group, otherwise you will not see the expected data.